Professional tennis is often decided by a surprisingly small number of points. A player may win more total points during a match and still lose because of poor execution during critical moments.
Among all performance indicators in tennis, break point efficiency remains one of the most important statistical measures for understanding match outcomes. While serving percentages and baseline consistency matter greatly over long periods, the ability to convert or save break points frequently separates elite competitors from the rest of the field.
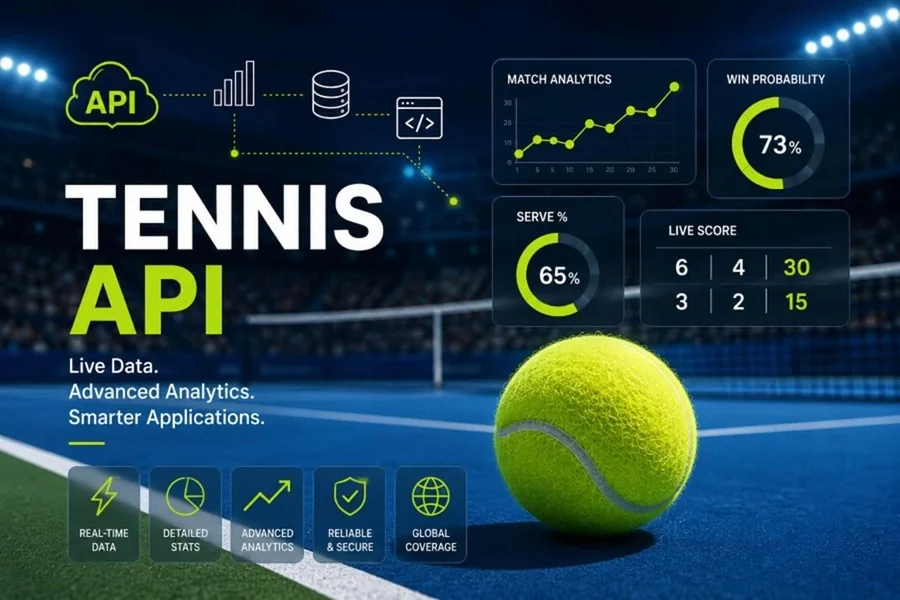
As tennis analytics becomes increasingly data-driven, analysts and developers now rely on structured datasets and live feeds from providers such as Tennis API platforms to study break point trends across ATP, WTA, Challenger, and ITF tournaments.
Modern predictive systems increasingly treat break point performance as a core variable when evaluating player quality and forecasting future results.
Why Break Points Matter So Much
Break points represent some of the highest-pressure situations in professional tennis.
Because holding serve remains relatively common at the highest levels of the game, especially on faster surfaces, individual service breaks often determine entire sets.
Break points therefore provide insight into:
- Mental composure
- Tactical decision-making
- Serve quality under pressure
- Return aggression
- Risk management
- Competitive resilience
Players who consistently perform well during break points often maintain stronger long-term results than players who rely purely on baseline statistical dominance.
The Difference Between Raw Statistics and Pressure Performance
Traditional tennis statistics can sometimes hide important contextual weaknesses.
For example, two players may hold similar service percentages over a season, but one player may struggle significantly during high-pressure moments.
A player who wins easy service games comfortably but performs poorly when facing break points may appear statistically stronger than they truly are.
This is why analysts increasingly separate:
- Overall service efficiency
- Pressure-point service efficiency
- Break point save rates
- Break point conversion rates
These pressure-adjusted metrics often provide stronger predictive value than simple averages.
Break Point Conversion Rates
Break point conversion percentage measures how efficiently players capitalize on opportunities to break serve.
Strong break point converters typically demonstrate:
- Aggressive returning
- High tactical awareness
- Confidence under pressure
- Ability to attack second serves
- Mental composure in key moments
Some players generate many break opportunities but convert poorly due to overly passive play or inconsistent decision-making during pressure situations.
Others consistently outperform expectations despite creating fewer opportunities overall.
This distinction becomes especially important in predictive modeling.
Break Point Save Percentage
On the serving side, break point save percentage reflects a player’s ability to maintain composure when facing immediate pressure.
Elite players often elevate their serving quality during critical moments through:
- Higher first serve accuracy
- Improved serve placement
- More aggressive shot selection
- Better tactical discipline
Break point save rates often correlate strongly with long-term tour success because they reveal mental resilience alongside technical serving ability.
Surface Conditions Change Break Point Dynamics
Break point importance varies substantially depending on court surface.
Grass Courts
On grass, holding serve is generally easier due to lower bounce and faster court speed. As a result, individual break points carry enormous importance.
Many grass-court matches are decided by only one or two service breaks.
Clay Courts
Clay creates slower conditions and more return opportunities. Players typically face more break points overall, meaning break point efficiency becomes tied closely to endurance and rally tolerance.
Hard Courts
Hard courts usually create more balanced conditions where both serve and return quality contribute heavily to break point outcomes.
Advanced forecasting systems therefore adjust break point models depending on surface type.
The Relationship Between Serve Quality and Break Point Success
Break point efficiency cannot be fully separated from serving ability.
Some of the strongest indicators of break point success include:
- First serve percentage under pressure
- Second serve points won
- Ace percentage on break points
- Double fault frequency during pressure moments
Players with weak second serves often struggle disproportionately during break points because opponents can attack aggressively.
This is one reason second serve metrics have become increasingly important in modern tennis analytics.
Historical Data and Long-Term Trends
One isolated match rarely provides enough information to evaluate pressure performance accurately.
Instead, analysts examine large historical datasets to identify recurring trends across hundreds of matches.
Long-term break point analysis often reveals:
- Surface-specific tendencies
- Performance against elite opponents
- Tournament-level variation
- Fatigue-related declines
- Age-related efficiency changes
Structured datasets and real-time feeds available through services such as the Tennis API coverage platform help analysts process these large statistical samples more effectively.
Why Rankings Alone Are Not Enough
ATP and WTA rankings remain useful measures of long-term consistency, but rankings alone often fail to capture underlying pressure dynamics.
For example:
- A lower-ranked player may excel under pressure.
- A higher-ranked player may rely heavily on weak tournament draws.
- Surface specialization may distort overall rankings.
Break point analysis helps uncover these hidden performance differences.
The Rise of Predictive Tennis Models
Modern tennis forecasting increasingly relies on machine learning and advanced statistical modeling.
Break point efficiency now serves as an important variable within many predictive systems.
Advanced models often combine:
- Surface-adjusted Elo ratings
- Service and return metrics
- Break point efficiency
- Tournament weighting
- Recent form indicators
- Fatigue analysis
By integrating these variables, predictive systems can generate more realistic match probability estimates.
Live Data and Real-Time Pressure Analysis
Real-time tennis data has dramatically changed how analysts evaluate pressure during matches.
Modern systems can now update forecasts dynamically using:
- Current break point trends
- Recent service performance
- Momentum shifts
- Medical interruptions
- Return efficiency changes
This allows live forecasting systems to adapt continuously as matches unfold.
The Psychological Component
Break point performance also highlights the psychological side of professional tennis.
Some players consistently thrive during pressure situations because they:
- Maintain aggressive intent
- Trust their patterns
- Control emotional responses
- Avoid tactical hesitation
Others become overly defensive or attempt low-percentage shots during critical moments.
While difficult to quantify perfectly, these behavioral differences often appear statistically over large sample sizes.
The Future of Break Point Analytics
Tennis analytics will likely continue becoming more granular over the next several years.
Future systems may analyze:
- Serve placement under pressure
- Shot selection on break points
- Player positioning patterns
- Biomechanical stress indicators
- Emotional response tracking
These developments could significantly improve predictive modeling and performance analysis.
Conclusion
Break point efficiency has become one of the most valuable indicators in modern tennis analytics. By studying how players perform during high-pressure moments, analysts can gain deeper insight into competitive resilience, tactical execution, and long-term performance trends.
As structured tennis datasets continue expanding, break point analysis will remain a critical component of predictive modeling, live forecasting, and advanced tennis research across all levels of professional competition.